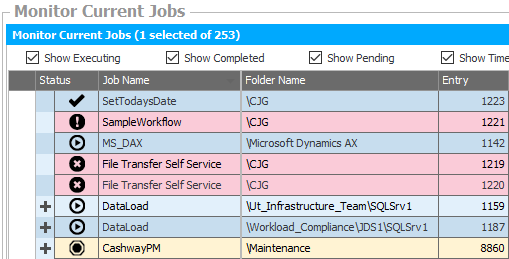
The Monitor enables users to view current Jobs and Setups in the Scheduler and provides access to comprehensive Job management tools. Use the following steps to open and manage current Jobs and Setups.
Accessing the Monitor
To get started, select the Monitor shortcut to open the Current Jobs View.
Customizing the Monitor View Using the Column Chooser
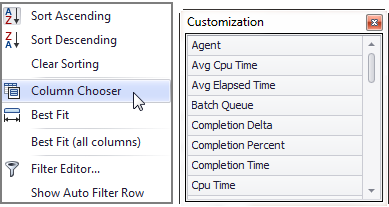
With the Column Chooser tool you to add, remove and repositions columns in the Monitor View, as well as the History and folder Views. To activate this tool, follow the steps below:
-
Right click on any column header within a View to open its context menu.
-
Select the Column Chooser command to display all column titles available in the Customization window.
-
To add a column to the current View, drag and drop a column title to the left or right of an existing column.
 |
Note: Double-clicking a column title appends the new column to the rightmost position within the current View. |
-
To remove an existing column, just drag and drop its header out of position until an “X” appears and then release the mouse.
-
To reposition any column, drag and drop the column header into the desired position within the current View.
To learn about sorting and filter the Monitor results, go to the topic: Working with Views.
Monitor View Icons
Every Job and Setup contained in the Monitor view includes an icon showing the current state of each entry as listed in the table below.
| Icon | Job or Setup Status Description |
 |
Waiting for a dependency to complete |
 |
Currently executing |
 |
Halted, usually due to a failed Setup Job |
 |
On hold by the user |
 |
Pending-waiting for a Setup Job step to begin executing |
 |
Status flagged as containing an error |
 |
Status flagged as fatal |
 |
Status flagged as "informational", based on specific source code values or the Execution Method |
 |
Status flagged as successful |
 |
Status flagged as containing a warning |
 |
Timed or scheduled |
Managing a Job or Setup
To manage a Job currently in the Schedule, right-click on a Job from the Monitor Current Jobs View to open its context menu.
Select the Show Details command or just double-click the Job name to open its defintion window.
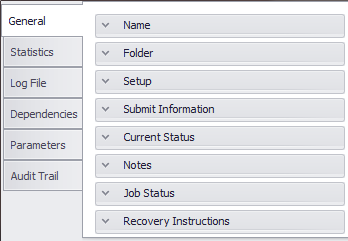
Each Job or Setup listed in the Scheduler displays a number of properties as shown in the above screenshot and detailed in the table below.
| Job Properties | Description |
|---|---|
| General | Displays Folder, Setup, Submit and Job status information. |
| Statistics | Shows times, execution statistics and related charts. |
| Log File | Lists all OS generated logs. |
| Dependencies | Details the dependencies for the Job or Setup. |
| Parameters | Details parameter names and values associated with the Job or Setup. |
| Audit Trail | Lists audit trail items for the Job, including: message, comment, user name, local and UTC audit times. |
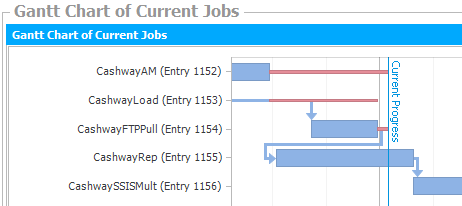
Using the Gantt View
The Gantt View provides a visual representation of currently scheduled Jobs or Setups. It plots their current run times against average run times.
Like the Monitor, the Gantt View provides quick access to the properties (e.g. parameters, security and dependencies) for each JAMS Job or Setup.
To open a properties window for a particular Job or Setup, right-click on an individual bar graph on the Gantt diagram and select the Show Details command from the context menu or simply double-click the object.