All scheduled JAMS Jobs or Setups contain a variety of properties. To access these properties, double-click the Job or Setup from the Monitor Current Jobs view.
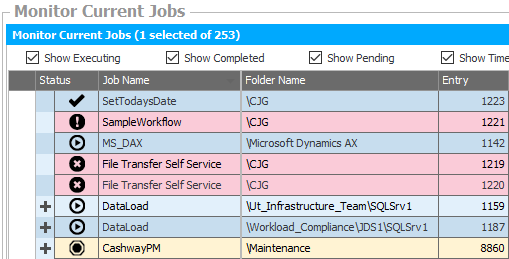
Each Job or Setup listed in the current schedule is organized into 6 tabs which are described in detail in the following sections.
The General tab is divided into 8 sections. The properties within these sections typically contain high-level information about the scheduled Job or Setup. Each section and their associated properties are detailed below.
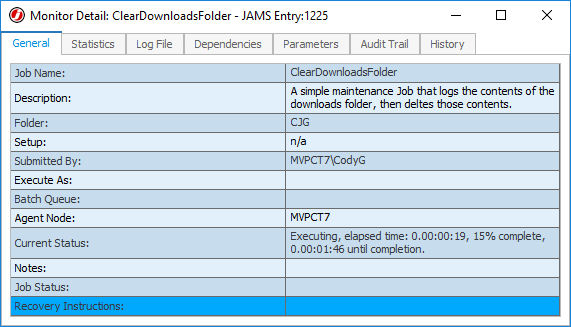
Name
The Name section includes the name and description of the Job or Setup.
Folder
This section shows the path and folder name where the Job or Setup is located.
Setup
The General tab’s third section displays the name of the Setup.
 |
Note: if the selected entry is a Job, the display returns "n/a". |
Submit Information
The Submit Information section contains four properties that include more specific details about the Job or Setup.
Submitted By
This property displays the username who submitted the Job or Setup.
Execute As
Displays the executed under username.
Batch Queue
Includes the batch queue name.
Agent Node
Includes the node where the Job or Setup is scheduled to run.
Current Status
This section displays the current status for the Job or Setup.
Notes
This JAMS-generated property provides additional information about the Job or Setup. This notation can be set in two ways: through the .Net API using the Submit-JAMSEntry Powershell cmdlet or by specifying a value for “–Comment”.
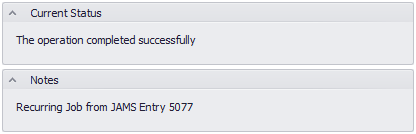
Job Status
Includes a user-defined informational message that is set from within the command procedure (SetJamsStatus) when the Job or Setup is being executed.
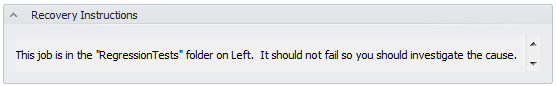
Recovery Instructions
This property contains instructions if the Job triggers a recovery email. These instructions are defined within the Job or Setup properties (Properties tab > Recovery section).
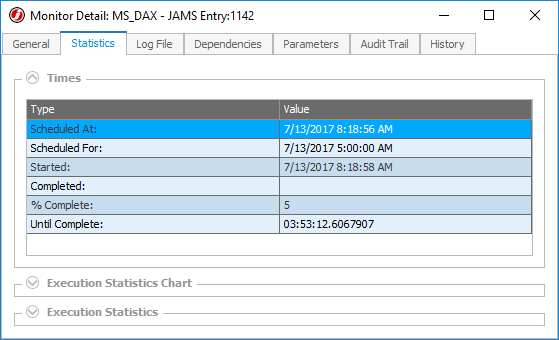
The Statistics tab provides measurements that show how the Job or Setup instance is performing. The tab is divided into three sections (Times, Execution Statistics Chart, and Execution Statistics).
Times
The Times section displays a table showing performance measures for the selected Job or Setup. These values are divided into six categories.
Scheduled At
Includes the date and time when the Job or Setup was initially scheduled in the Monitor.
Scheduled For
Includes the date and time when the Job or Setup was scheduled.
Started
This property displays the Job or Setup’s start time and date.
Completed
Includes the date and time when the Job or Setup completed its run.
% Complete
Provides the current Job or Setup’s completed status.
Until Complete
Displays the approximate time to complete the Job or Setup.
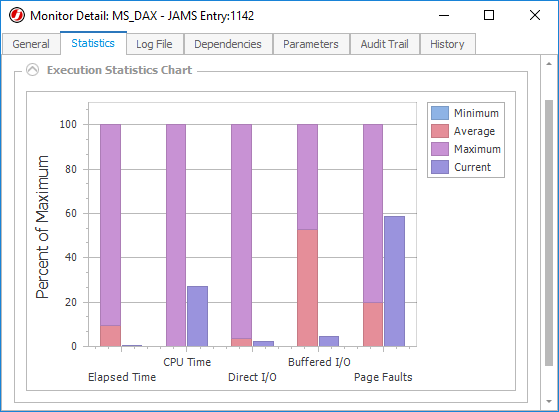
Execution Statistics Chart
This section compares the Job or Setup’s current runtime with its historic averages using a bar chart format.
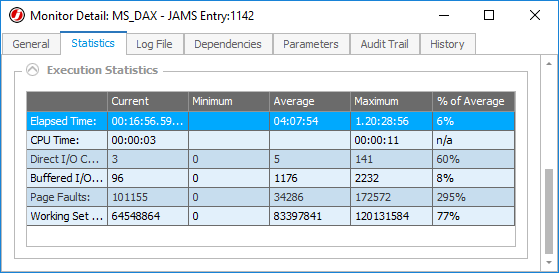
Execution Statistics
This section includes detailed performance measures, such as elapsed and CPU time, for the scheduled Job or Setup.
This tab displays the Log File that is generated by the operating system for each Job or Setup's run instance.
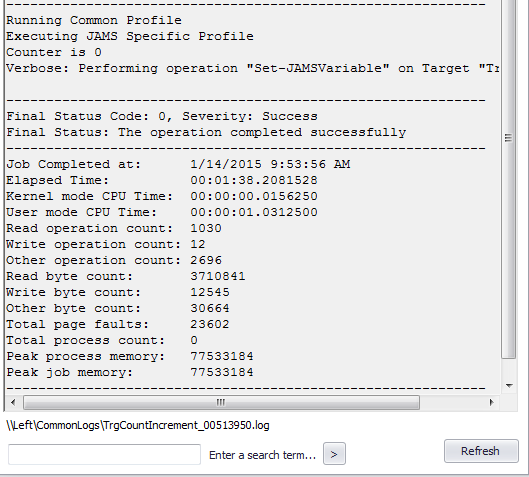
|
Note: a Job or Setup must fully complete before the Log File becomes available. If necessary, use the Refresh button to reload the Log File. |
This tab provides a list of Dependencies for the current Job or Setup.

Status
If a Job/Setup contains a Dependency its current status is shown here either as: OK, Waiting or Not Checked.
Description
This property includes a brief description of the Dependency.
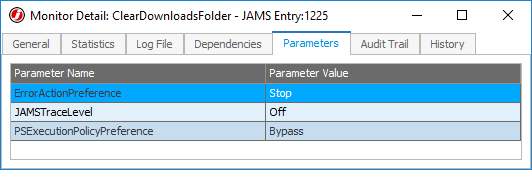
This tab displays a list of Parameters for the Job or Setup. Each Parameter contains the following information: the Parameter Name and the Parameter Value.
The last tab includes a listing of all Audit Trail items pertaining to the current Job or Setup: including messages (for Dependencies and Triggers), comments, user name, and local and UTC audit times.
